Reduce Engineering Costs: 20% Prioritization for Engineering Managers
The fastest, largest reductions in engineering costs come from three levers: treating cost as a design variable through Design to Cost and DFM, using simulation to cut prototypes and late rework, and fixing component and process failure modes through supply-chain governance and digitized handoffs. Simulation-led programs have cut physical prototype counts roughly in half in published case studies. The rest of this guide breaks each lever into steps you can start this week.
TL;DR:
- Conduct a cost estimate during design reviews to identify expensive geometries early, despite adding 30 to 60 minutes to the process.
- Simulate one high-risk part to potentially eliminate one or two prototypes, but only after validating the model against a physical test for trustworthiness.
- Build a preferred-parts list with alternates and actively track end-of-life status to prevent costly redesigns and supply disruptions during development.
- Implement design-to-cost strategies, such as geometry simplification and standard fasteners, to reduce manufacturing costs by up to 30 percent in targeted areas.
- Use digital workflows like BOM synchronization, automated change notices, and templated inspection criteria to cut errors and rework in engineering handoffs.
Table of Contents
- Reduce Engineering Costs: An 8-Step Weekly Checklist
- Design to Cost and DFM: Making Cost a Design Variable
- Simulation Cuts Prototypes and Stops Late-Stage Rework
- Component Strategy and Supply-Chain Resilience
- Digitizing Engineering Handoffs Cuts Errors, Not Just Effort
- Team Costs and the Real Price of Engineer Turnover
- Where I’d Start If the Budget Were Tight
- Cut Ramp Time and Hiring Overhead With Amazing Devs
- Sources
- FAQ
Reduce Engineering Costs: An 8-Step Weekly Checklist
Most cost-reduction advice fails because it asks for a six-month transformation before it shows a single dollar saved. The list below is built the other way. Every item is something an engineering manager can start this week, with a rough payoff and the trade-off that comes with it.
- Add a cost estimate to your next design review. Benefit: catches expensive geometry before tooling is cut. Trade-off: adds 30 to 60 minutes to the review agenda.
- Pull your top 10 highest-cost parts and rank them. Benefit: shows exactly where value engineering effort should go. Trade-off: requires accurate BOM cost data, which some teams don’t have yet.
- Simulate one high-risk part instead of building a third prototype. Benefit: can eliminate one or two physical iterations. Trade-off: needs a validated model before you trust the output.
- Audit your preferred-parts list for end-of-life risk. Benefit: avoids emergency redesigns triggered by component shortages. Trade-off: takes a few hours of procurement research.
- Standardize fasteners and subassemblies across one product line. Benefit: cuts part-number count and unit cost. Trade-off: may require re-tooling a handful of legacy parts.
- Map your worst manual handoff between engineering and manufacturing. Benefit: targets the automation with the best ROI. Trade-off: uncomfortable to expose in front of the team.
- Calculate what your last engineer departure actually cost. Benefit: builds the business case for retention investment. Trade-off: the number is usually higher than leadership assumes.
- Get one quote for nearshore staff augmentation on a stalled project. Benefit: shows real cost comparison against local hiring or contractor rates. Trade-off: takes a short discovery call to get accurate numbers.
Items 2, 3, and 7 do the most work. They map almost directly to the Pareto principle behind value engineering: a small share of parts, redesigns, and people decisions drive most of your budget variance.
Pro Tip: Run items 2 and 6 in the same meeting. The highest-cost part and the worst handoff are frequently connected, and fixing one often exposes the fix for the other.
Design to Cost and DFM: Making Cost a Design Variable
Design engineers influence roughly 70% of a product’s total cost before a single unit reaches the factory floor, according to aPriori’s overview of Design to Cost methodology. That number should change how you run design reviews. Cost-cutting that happens after tooling is locked is damage control. Design to Cost (DTC) is the alternative: it treats cost as a hard design constraint from the first sketch, the same way weight or strength is constrained in aerospace work.

DTC is not the same as chasing cheaper suppliers after the fact. Post-hoc cost cutting reacts to a budget overrun. DTC prevents the overrun by giving engineers a cost target and the tools to hit it during the design phase itself.
A handful of tactics do most of the heavy lifting:
- Tolerance strategy. Tightening a tolerance beyond what the application needs is one of the most common sources of avoidable machining cost. DFM reviews focused on tolerance relaxation and smarter process selection have delivered 15 to 30 percent savings on the parts they touched.
- Geometry simplification. Fewer machining setups, fewer draft-angle exceptions, fewer secondary operations.
- Part-count reduction. Every eliminated part removes its own purchasing, inspection, and inventory cost.
- Standard fasteners and subassemblies. Commodity hardware is cheaper to source, stock, and replace than custom equivalents.
Manufacturing cost-estimation platforms can automate the machine-level cost analysis that used to require a specialist, flagging cost drivers as soon as a model is uploaded rather than weeks later at quote time. The gate that matters most is the one before tooling commitment. If cost checks happen after that gate, you’re negotiating with sunk costs.
Put someone in charge of DTC explicitly. It fails as a shared responsibility because shared responsibility means nobody owns the target. Track two metrics: cost-per-part estimate versus target at each design gate, and engineering change order (ECO) rate after release. A rising ECO rate after launch is usually a sign that cost and manufacturability got rubber-stamped instead of reviewed. Start with one product line as a pilot before rolling DTC out across the portfolio. It’s easier to fix a broken review process on one program than to retrofit five at once.
Simulation Cuts Prototypes and Stops Late-Stage Rework
Late-stage redesigns are the most expensive mistakes in engineering, because by the time a flaw shows up in physical testing, tooling is cut and schedules are locked. Cloud-native simulation and physics-based engineering AI attack this directly. Published implementations have halved physical prototype counts while cutting material and tooling spend, by finding the optimal design before a single mold is machined.
Not every simulation type earns its cost equally. Four categories consistently deliver the best return:
- Structural simulation for parts under repeated load, where a physical fatigue test can take weeks.
- Thermal simulation for enclosures and electronics, where thermal failure is one of the most common causes of field returns.
- CFD for anything involving airflow or cooling, where physical wind-tunnel testing is slow and expensive to iterate.
- EMI/EMC simulation for electronics that would otherwise fail compliance testing late, after the PCB layout is finalized.
The workflow that works is narrow, not broad. Pick one high-risk part, the one whose prototypes currently eat the most test-lab hours or whose failure would trigger the costliest redesign. Set explicit pass/fail thresholds before you run the simulation, not after you see the results. Then validate the model against exactly one physical prototype. If the simulation and the physical test agree, you’ve earned the right to trust the model for the next iteration without building another unit.
Pro Tip: Don’t try to validate simulation against every part at once. Pick the single part where a physical prototype run is most expensive in dollars or schedule days, and prove the model there first.
ROI shows up in three places: prototypes avoided, material saved per unit, and test campaigns shortened. Track all three from the pilot, because leadership will ask for the number before approving a wider rollout. Choose a simulation tool that fits your existing CAD environment, since re-platforming your design software to add simulation capability usually costs more than the savings it’s meant to produce.
Component Strategy and Supply-Chain Resilience
A part that goes end-of-life mid-program doesn’t just cost money to replace. It costs an emergency redesign, a requalification cycle, and a schedule slip that ripples into every downstream deliverable. Component governance is how you prevent that from happening in the first place.
- Build a preferred-parts list with alternates. Every commonly used component should have at least one qualified alternate mapped to it, so an EOL notice doesn’t send engineering scrambling.
- Track end-of-life status actively, not reactively. Set a quarterly review instead of waiting for a distributor notice to force the issue.
- Consolidate volume across product lines. Buying the same connector across three products instead of three slightly different connectors gives you real leverage in vendor negotiations.
- Negotiate on total cost, not unit price. Lead time, minimum order quantities, and second-source availability often matter more than a few cents per unit.
- Decide regionalization case by case. Global sourcing wins on unit cost; regional sourcing wins on lead time and resilience when a single-region supply chain gets disrupted.
- Build spec flexibility into new designs. A part spec written around one supplier’s exact package size guarantees a redesign the day that supplier has a shortage.
The 2021 to 2022 component shortage cycle taught a lesson many engineering teams are still relearning: a design that only works with one exact part number is a design with a hidden cost, and that cost only shows up when you can least afford it. Start this week with a 30/60/90 day plan: 30 days to build the preferred-parts spreadsheet, 60 days to identify alternates for your top-risk components, 90 days to renegotiate volume pricing on your highest-spend parts.
Digitizing Engineering Handoffs Cuts Errors, Not Just Effort
Manual handoffs between engineering and manufacturing are where most avoidable rework hides. A dimension that’s correct in the CAD model but ambiguous on a 2D drawing gets interpreted differently on the shop floor than the engineer intended, and that gap shows up as a rejected first article weeks later.
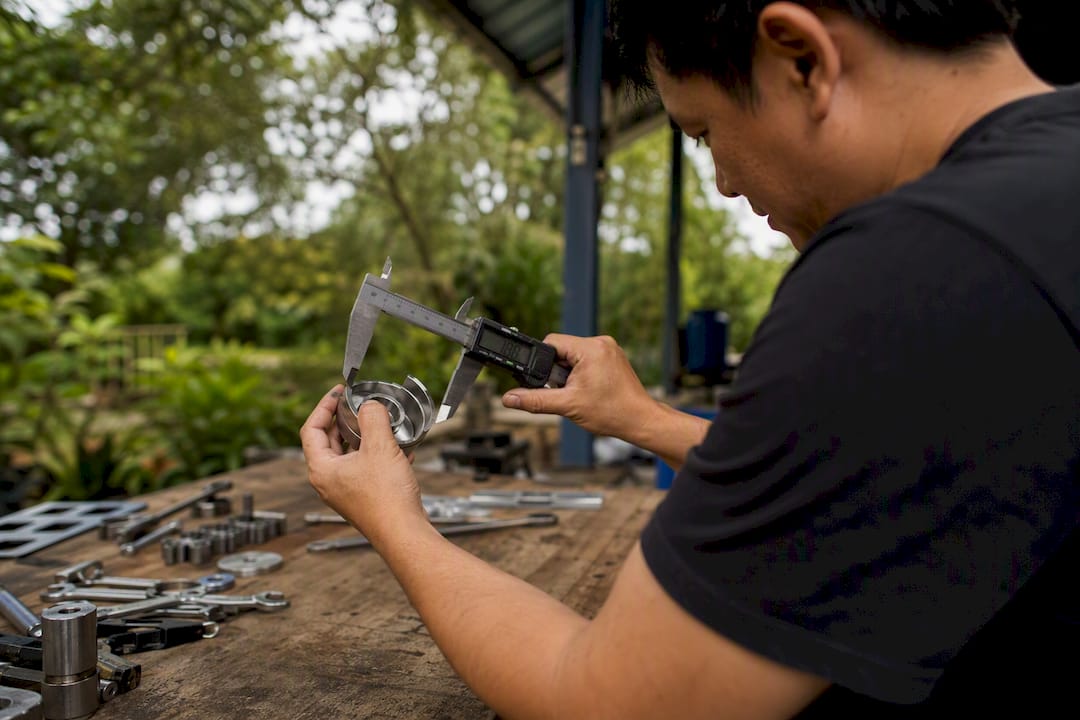
Model-based definition (MBD) attacks this by making the 3D model itself, not a separate drawing, the single source of truth for tolerances, GD&T, and inspection criteria. Combined with PLM and ERP integration, digital engineering workflows have measurably cut first-article inspection cycles and unit cost by removing the interpretation gap between design intent and shop-floor execution.
You don’t need a full digital-transformation program to see results. Three specific automations deliver outsized impact relative to their setup cost:
- BOM synchronization between CAD and ERP, so a part change doesn’t require someone manually updating three separate systems.
- Automated change notices that route to every affected stakeholder the moment a design changes, instead of relying on someone remembering to forward an email.
- Templated inspection criteria tied directly to the model, removing ambiguity from what “acceptable” means on the shop floor.
Pick one product line, map every handoff from design release to first production run, and automate whichever step has the highest error rate. Track ECO frequency, first-article rejection rate, and manual rework hours before and after. If those three numbers don’t move within a quarter, the automation targeted the wrong step.
Team Costs and the Real Price of Engineer Turnover
Losing an experienced engineer costs far more than the recruiting fee suggests. It takes an average of eight months to fully replace a departed developer, and the capacity loss during that gap alone runs between $4,400 and $13,400 depending on the region. Add recruiting fees, onboarding time, and the institutional knowledge that walks out the door, and a single departure can quietly consume a meaningful chunk of a project’s budget. Separate turnover benchmarking data shows the same pattern: recruiting, ramp time, and lost productivity compound into a total replacement cost that most engineering budgets never explicitly account for.
Retention is almost always cheaper than replacement, and the highest-ROI levers aren’t exotic:
- Structured onboarding that gets a new hire to full productivity in weeks instead of months.
- Knowledge capture so a departure doesn’t erase undocumented decisions along with the person who made them.
- Faster hiring cycles, since a slow process loses candidates to competitors and extends the capacity gap.
- Competitive benefits, which matter more for retention than most engineering leaders assume, especially against remote-first competitors.
Nearshore staffing is worth evaluating as a structural fix, not just a stopgap. It doesn’t eliminate turnover risk, but it changes the cost math around ramp time and hiring speed. Amazing Devs, for example, sources and vets Brazilian developers for cultural fit and technical skill before a client ever runs an interview, which compresses the part of the eight-month replacement timeline that’s usually spent on sourcing and screening. Evaluate any nearshore partner on three things: how rigorously they screen for both technical skill and team fit, how they handle contracts and compliance, and how fast they can actually staff a role once you say yes.
Pro Tip: Calculate your own last-hire replacement cost before your next budget meeting. Most engineering managers underestimate it until they add up recruiting, ramp time, and the redesign delays caused by lost institutional knowledge.
Combining the two, tightening retention on your core team while using nearshore staffing for scaling or specialized capacity, lowers total engineering spend without leaving critical projects understaffed while you wait for a slow hiring pipeline to produce a candidate.

Where I’d Start If the Budget Were Tight
If I had to pick three moves on a constrained budget, I’d start with the cost gate at design review, one simulation pilot on your riskiest part, and an honest turnover-cost calculation. None of the three requires new headcount or a big software purchase, and all three produce a number you can bring to your next budget meeting.
Expect a pilot-to-scale timeline of three to six months. The first month is picking the right part and the right review to attach a cost check to. By month three, you should have a concrete before-and-after number, prototypes avoided, an ECO rate that moved, or a validated replacement-cost figure. That’s when it makes sense to scale the practice across more product lines.
The most common pitfall isn’t picking the wrong tactic. It’s running four of them at once and losing the ability to tell which one actually moved the needle. Pilot one thing, measure it cleanly, then expand.
— Gabriel
Cut Ramp Time and Hiring Overhead With Amazing Devs
Every lever in this guide reduces engineering costs by removing waste, wasted prototypes, wasted rework, wasted redesign cycles. Team costs waste time the same way, and that’s the gap Amazing Devs is built to close. Instead of spending months sourcing, screening, and negotiating with individual candidates, you get pre-vetted Brazilian developers matched for technical skill and team fit, with contracts and compliance already handled.
That matters most when you’re weighing the eight-month replacement timeline against a project deadline that can’t move. Amazing Devs shortens the sourcing and screening phase that eats most of that timeline, so a role that would take months to fill through a traditional hiring pipeline can be staffed with someone already assessed for the job. Before a discovery call, it helps to have three things ready: the role’s technical requirements, your timeline for ramping the person up, and whether you need one engineer or a small team. If you’re still deciding between models, the difference between nearshore and offshore outsourcing is worth understanding before you commit. When you’re ready to see actual candidate profiles and turnaround times, start with Amazing Devs and bring your open role to the conversation.
Sources
The claims in this guide draw on published methodology and cost benchmarks, including aPriori’s Design to Cost overview, SimScale’s simulation cost-reduction case studies, BlueOptima’s developer replacement cost research, Sekkei Tech’s value-engineering framework, and Katalyst Engineering’s digital engineering analysis. For managing AI and software tooling spend specifically, Tekkr’s guide to wasted AI software spend is a useful companion read.
- What Is Design to Cost? An Overview With Examples | aPriori
- Reduce R&D Costs | Cut Prototyping Costs | SimScale
- 8 months: the real cost of replacing software developers | BlueOptima
- Value engineering & machine design cost reduction | Sekkei Tech
- How digital engineering trends drive measurable reductions in unit cost | Katalyst Engineering
FAQ
What Are Engineering Costs?
Engineering costs cover everything spent designing, testing, and refining a product before and during production, including labor, prototypes, simulation, tooling, and the rework caused by late design changes.
What Is the Average Cost of an Engineer?
Salary varies widely by role and region, but the bigger budget risk is turnover: replacing a departed engineer takes about eight months and can cost $4,400 to $13,400 in lost capacity alone, before recruiting and onboarding are added in.
What Are Some Effective Strategies for Reducing Engineering Costs?
The highest-ROI strategies are Design to Cost and DFM at the design stage, simulation to cut physical prototypes, component and supply-chain governance, and process digitization to reduce manual rework. Nearshore staffing, like the model Amazing Devs uses, addresses the team-cost side by lowering hiring and ramp overhead.
What Does It Mean to Reduce Overhead Costs in Engineering?
Reducing overhead in engineering means cutting the indirect costs around a project, redundant tooling, manual handoffs, avoidable turnover, and late-stage rework, rather than cutting engineering headcount or scope.
How Do You Prioritize Which Cost-Cutting Effort to Start First?
Apply the Pareto principle: focus value engineering on the roughly 20% of parts or processes that drive 80% of total cost instead of spreading effort evenly across every line item.